


Get More Out of Real-Time Dashboard with the Latest Updates
Get More Out of Real-Time Dashboard with the Latest Updates
If you manage a customer support team, you’ll know how important and powerful it is to have well-defined performance metrics. The right set of metrics and KPIs empower teams to work together and show the path to how work should be done. The same applies to chatbot analytics.
Truly effective metrics come from data that delivers information–when numbers start telling stories and provide meaningful insights. However, many teams struggle to get the information they need to push their teams in the right direction.
To overcome this challenge, we are excited to announce an upgrade to our Real-time Chatbot Dashboard—a powerful and fresh perspective on how you view data to deliver delightful customer support experiences to your users.
More information and better decisions
We rebuilt the Verloop.io Real-time Dashboard to accommodate a slew of user and business needs. After interviewing a few clients, we understood our customers wanted more detailed information that was aligned with their business goals.
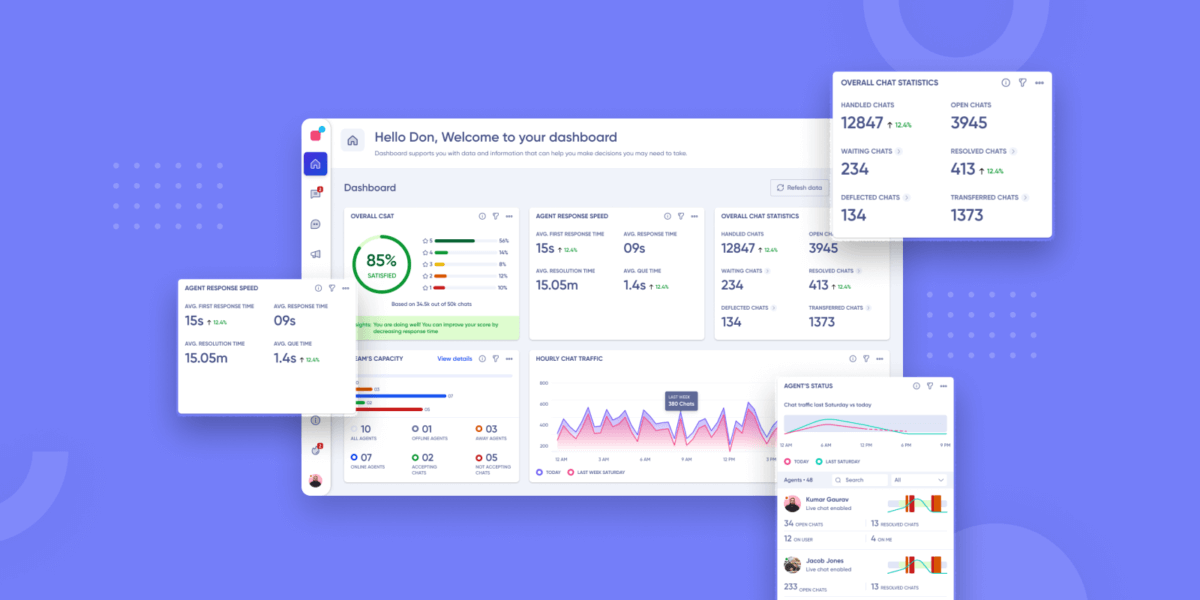
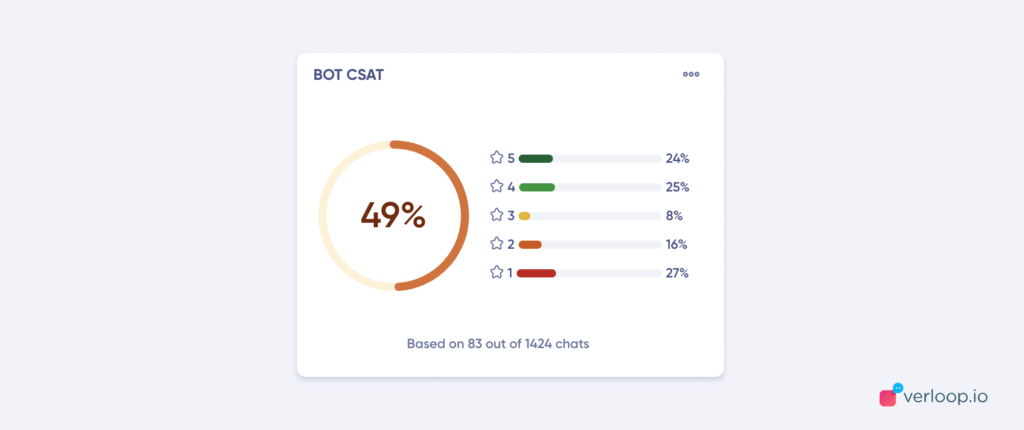
To ensure that kind of representation of data, going forward, Verloop.io users will see a visual summary of chatbot analytics and the team’s performance. The Real-time Dashboard helps the user:
- measure the speed of response,
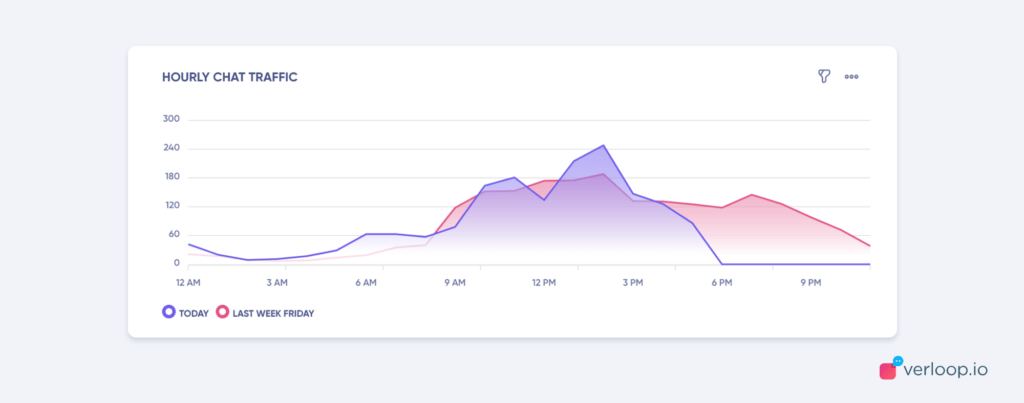
- monitor chat trends,
- view the average resolution time,
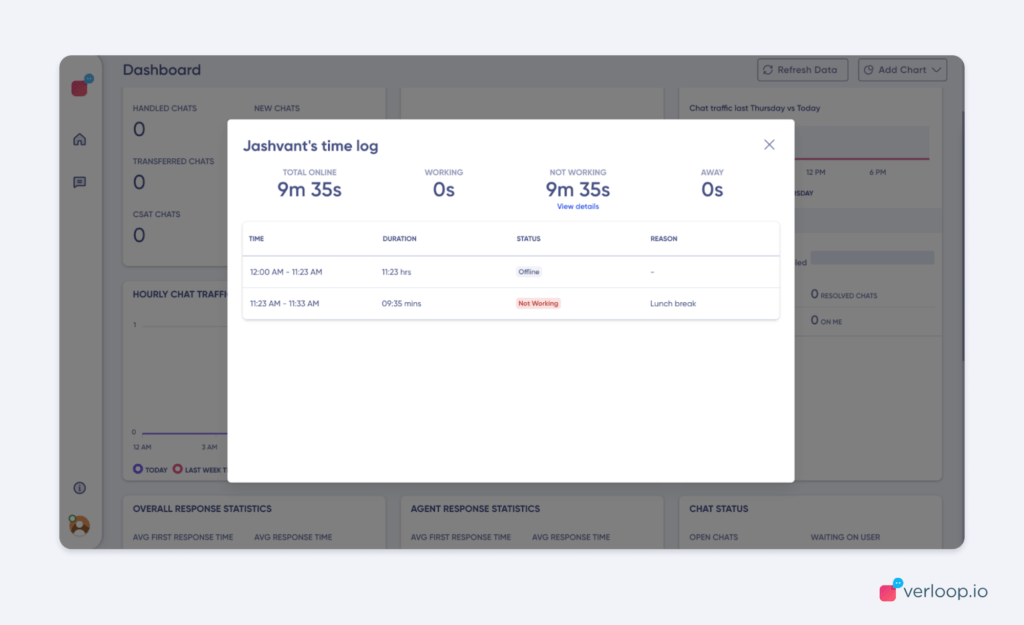
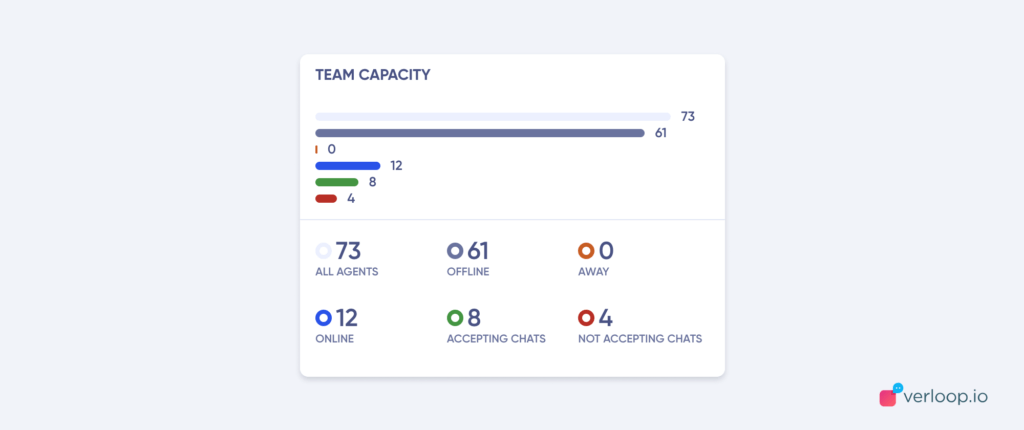
- deep dive into any agent’s workload, and
- get information on agent availability.
‘Putting in place’ like a chef
The French professional kitchen has a concept called ‘mise en place,’ which roughly translates to ‘putting in place.’ In this cooking method, the chefs maximise efficiency and reduce errors by preparing and arranging their ingredients and tools before cooking.
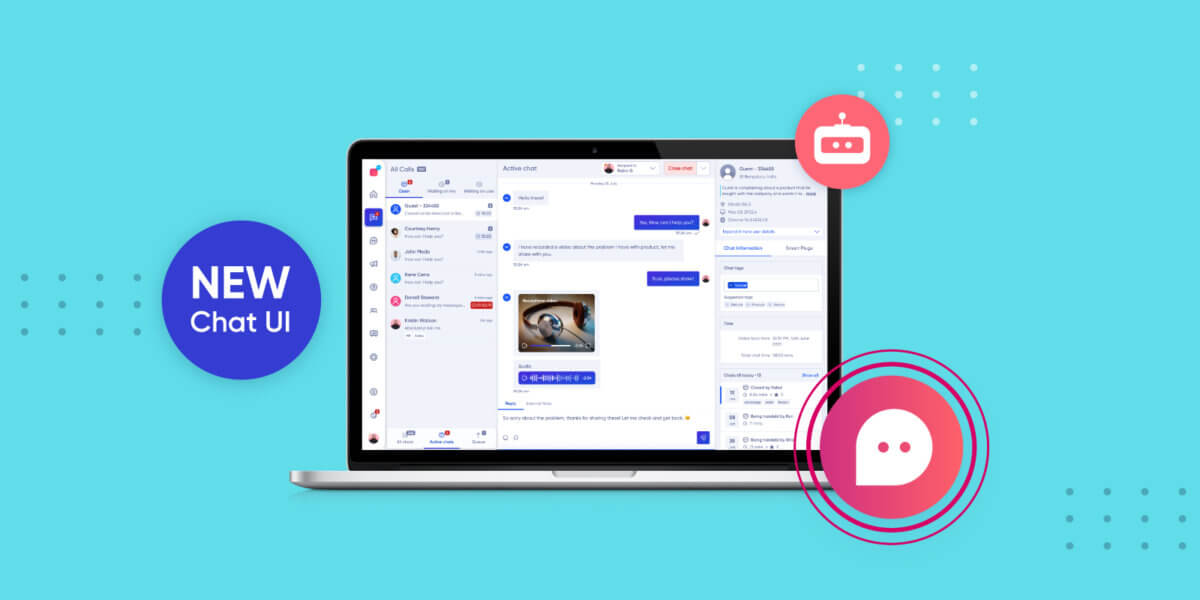
We’ve endorsed a similar approach for the Real-time Dashboard. As part of our efforts to update the UI for the chatbot analytics dashboard, we’ve rehauled the Real-time Dashboard to not only look aesthetically pleasing but also improve user experience, save time, and help make better/quicker decisions.
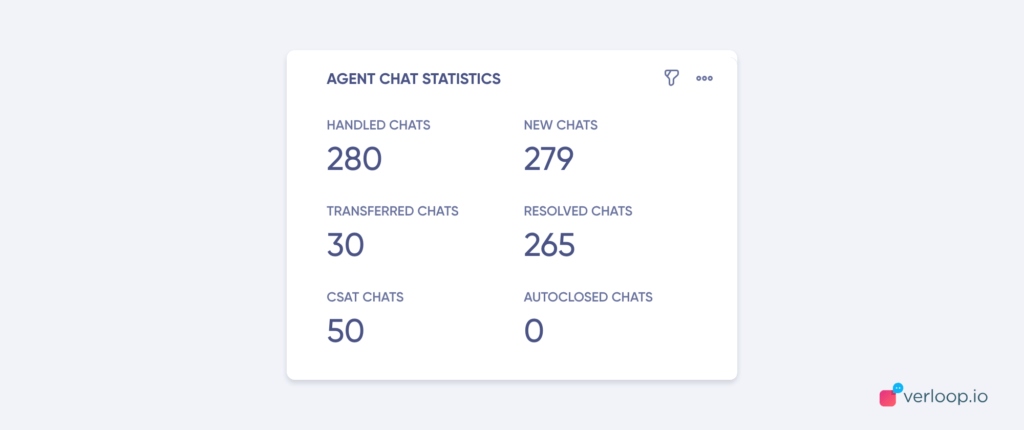
The new UI brings fragmented pieces of information together through widgets—an at-a-glance view of the important data and functionality. Admins and managers can see org-level data for chatbots and their teams through these widgets.
But it doesn’t end there. Admins and managers will have the flexibility to arrange these widgets based on the prioritization of their business needs. They will also have the option to add/remove a widget from their view and filter by Department data to get more specific information. These design functionalities will assist with quick decision-making, save time and result in cost-saving efforts along the way.
Get started with the chatbot dashboard
With this design update, all Verloop.io users will see a total of 12 widgets that’ll help them work collaboratively and define the path their teams need to take.
The refreshed look of the Real-time Dashboard is only the tip of the iceberg. The team has put in a lot of rigour to make the platform more flexible and extensible. That means, in the future, if a user has any custom requirements, the team will be able to support them with that information on the dashboard.
A big shoutout and kudos to the product, tech, and customer teams to get this up and running efficiently.
Sign up for a demo to see the new dashboard and how it helps you take revenue-driving actions.