


Customer Support Metrics: Definitions and How to Improve

Customer Support Metrics: Definitions and How to Improve
We discuss 15 essential customer support metrics, their definitions and tips to improve them.
What’s measured, improves. And to improve your customer support, you need to measure customer support metrics. These metrics provide data on your support team’s performance, efficiency and quality of service.
But where do you start? What metrics are important to measure? Why are they important to measure? And how to improve these metrics?
In this article, we will help you answer these questions so that you can track your customer service metrics and double down on what works and improve where customer experience breaks.

Benefits of measuring customer support metrics
To know if you are doing something right, you need to measure it. For example, if your goal is to lose weight, you have to step on a weighing machine to measure it. Similarly, if your goal is to provide excellent customer service, you need to measure it. And you need to do it with the right metrics.
“Without data, you are just another person with an opinion.” – W. Edwards Deming
Metrics serve as benchmarks for specific performance indicators on your team. Hence, defining the metric, understanding why you want to track and knowing what steps you need to take next are really important.
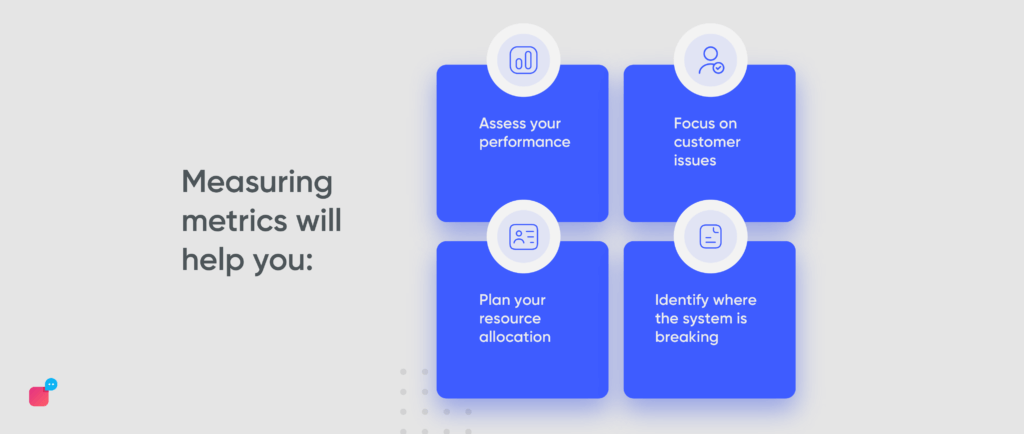
Measuring metrics will help you:
- Assess your performance
- Focus on customer issues
- Plan your resource allocation
- Identify where the system is breaking
What are the main metrics of customer support?
Identifying the right set of customer service metrics, measuring them consistently and using them for decision-making is a sure-fire way to achieve success — for both you and your customers.
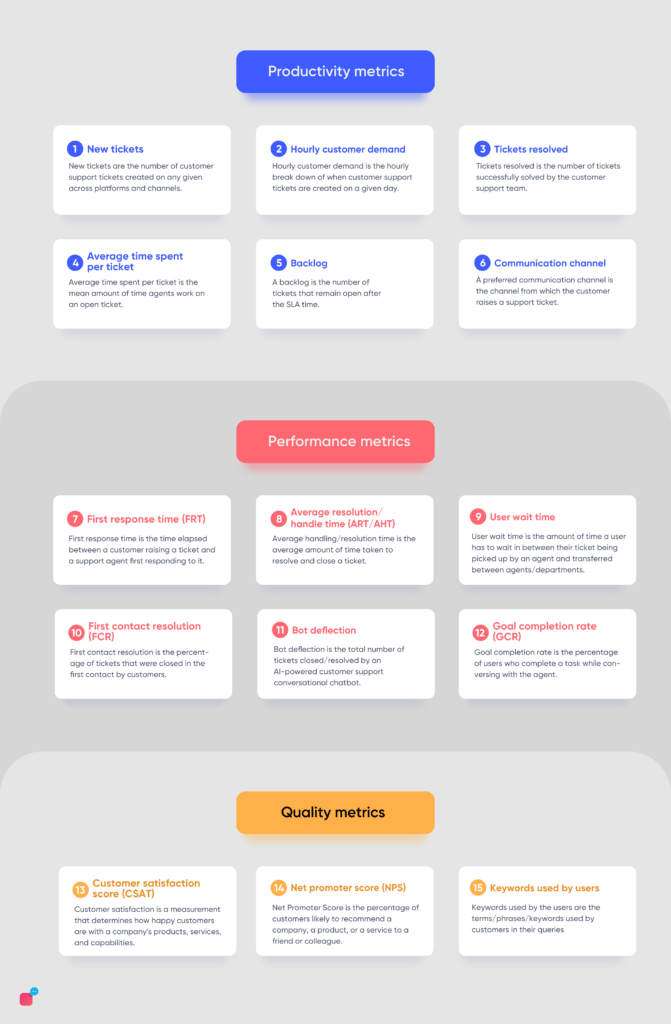
For better understanding, we will broadly classify the customer support metrics and Key Performance Indicators (KPIs) into three categories:
- Productivity: measures how much work is being done
- Performance: measures how well the work is being done
- Quality: measures the impact of the work that’s being done
Each of these categories has metrics that help you measure the success of your customer support.
Productivity metrics
- New tickets
- Hourly customer demand
- Tickets resolved
- Average time spent per ticket
- Backlog
- Communication channel
Performance metrics
- First response time (FTR)
- Average resolution/handle time (ART/AHT)
- User wait time
- First contact resolution (FCR)
- Bot deflection rate
- Goal completion rate (GCR)
Quality metrics
- Customer satisfaction score (CSAT)
- Net promoter score (NPS)
- Keywords used by users
Let’s look at each of category of customer support metrics in detail and see how we can improve them
Customer support metrics to measure productivity
As the name suggests, these metrics measure how much work is there and how much is being done. It gives you an idea of how to plan your resources’ time and optimise it for best performance.
1. New tickets
Definition: New tickets are the number of customer support tickets created on any given platform and channel.
This metric shows the demand for customer support from your customers. In general, as your business grows, so will your customer base and hence the number of support tickets created. But if you see a surge in new tickets, it means somewhere the process is broken or the product quality isn’t up to the mark and your users are raising a complaint.
The tickets could be raised on any channel, such as phone, email, chat, social media, etc. This customer service metric should be measured on a daily, weekly and monthly basis. It not only shows how often your customers need support but also points to the pressure on your support agents.
Once you know this number, you can plan your staffing needs.
How to improve:
Reduce the number of new support tickets created by
- proactively communicating with your customers,
- onboarding users on time,
- sharing how-to guides post purchase,
- keeping your knowledge-base up to date and accessible.
2. Hourly customer demand
Definition: Hourly customer demand is the hourly breakdown of when customer support tickets are created on a given day.
This customer support metric shows you the demand for support at different hours of the day. By tracking this data, you can identify which hours of the day or days of the week/month you see a surge in customer support tickets.
Depending on your business type, you will notice a trend and can provide a better customer experience. For example, a food delivery company will see daily surges during meal times and a cosmetics company will see a surge of tickets during sales/ holidays.
How to improve:
This is a metric that you cannot improve the number. But by knowing the customer demand, you can definitely improve your customer’s support experience by preparing for the surge.
Based on this information, you can
- set your agents’ working hours,
- increase the number of support agents handling tickets at those hours.
Suggested Reading: Holiday Season Support: Optimising For Speed And Surge In Demand
3. Tickets resolved
Definition: Tickets resolved is the number of tickets successfully solved by the customer support team.
This metric is important because it shows your customer service team’s capacity. If the ratio of new tickets to resolved tickets is high, it means your support agents aren’t able to handle the load. This has a cascading effect as it creates a backlog and eventually leads to lower customer satisfaction.
On the other hand, if you can successfully resolve all tickets that are created, it could mean you are overstaffed. You can assign other tasks to your agents.
You can also go into details here to see the number of tickets resolved by individual agents and find out how productive they are. This way you can identify your top performers and use them as an example to train your underperformers.
How to improve:
It’s a big problem if you have a high number of unresolved tickets. To reduce this number, you can
- automate some aspects of your customer support like frequently asked questions,
- train the agents with various use cases so they can resolve the tickets assigned to them.
4. Average time spent per ticket
Definition: Average time spent per ticket is the mean amount of time agents work on an open ticket.
While the definition of this customer service metric is pretty straightforward, the implication is big. This is a clear indication of how productive your agents are.
A similar metric would be the number of interactions per ticket. If the number of messages between the customer and agents is high, it usually means that the time spent on a ticket is also more.
If the agents are spending more time on tickets, it could mean two things:
- They are handling many complex questions
- They are not handling the tickets efficiently
Whatever might be the case, a high average time spent per ticket indicates your staff is not asking the right questions or is having trouble understanding the customer’s requirements.
How to improve:
To reduce the average time spent per ticket, here are a few things you can do:
- train agents to understand the customers better,
- share unified customer profiles with agents so they have context on customer queries,
- use canned responses to reduce the time taken to type common statements.
5. Backlog
Definition: A backlog is the number of tickets that remain open after the SLA time.
Tickets that don’t get closed on time are termed as backlog. Needless to say, this customer service metric should be kept at a minimum. The higher your backlog number, the more unhappy customers you’ll have.
It’s important to define what a backlog is. It depends on what you tell your customers on how long it takes to resolve an issue — it could be 24 hours or a couple of days. If the ticket is not resolved in the timeframe you promise a customer, it’s moved from open to a backlog. SLA changes from channel to channel. A call centre or a chatbot has a lower SLA than an email.
There could be many reasons for backlogs. Your team could be understaffed, or you are seeing a surge in tickets after a new product/ service launch. Either way, it indicates your customer service team isn’t prepared to handle the tickets and it’s time to take action.
How to improve:
To improve the backlog, you need to understand what’s causing the backlog. Are you understaffed? Are the tickets being missed by agents? Is the complexity of backlogged tickets high?
Once you’ve analysed the tickets in the backlog and found the source of the issue, you can rectify it by:
- increasing the number of customer support staff,
- automating commonly asked questions,
- prioritising tickets that are nearing SLA.
6. Communication channel
Definition: A preferred communication channel is the channel from which the customer raises a support ticket.
This customer service metric tells you the customer’s preference in contacting your company for customer support. Based on this data, you can optimise the most preferred channel and improve your customer’s experience even further.
There are many channels of communication these days. From website chatbots to WhatsApp chatbots, social media to call centres, and emails to voicebots.
Depending on the nature of your business and your target audience, your customer’s preferred channel of communication will change. For example, Baby Boomers prefer email and voice calls whereas Millennials and Gen Z prefer messaging.
How to improve:
It’s best to optimise channels which your customers prefer. Once you identify that, you should:
- allocate more agents to the preferred communication channel,
- set up customer support on channels your customers are,
- promote your channels to customers so they reach out for support on those channels.
Customer support metrics to measure performance
These metrics measure how well the agents are supporting the customers. These metrics will let you know if your customers are satisfied with the experience you are providing them.
7. First response time (FRT)
Definition: First response time is the time elapsed between a customer raising a ticket and a support agent first responding to it.
First response time has the same energy as first responders. Just like how the first responder is the first to arrive and provide assistance at the scene of an emergency, first response time is the time taken to first respond to a customer query, providing immediate acknowledgement of the customer.
The faster the response, the better the customer experience.

The average FRT changes depending on the platform/channel on which the customer is contacting customer support. It differs for phone calls, chatbots, support agents on live chat, email, etc.
You can calculate the first response time for different channels and identify which is the fastest. You can then promote this channel to your customers so they can resolve their queries quickly. This can have a big impact on the quality of your customer service function.
How to improve:
To respond to a customer asap,
- automate processes so you can acknowledge the customer query immediately.
Chatbots and voicebots can help you reduce your first response time drastically. If the customer contacts support through email, an automated response can be sent to the customer, letting them know of the estimated time to hear back from an agent.
8. Average resolution/handle time (ART/AHT)
Definition: Average handling/resolution time is the average amount of time taken to resolve and close a ticket.
This customer support metric shows how efficient your support team is. In a way, you can say that your customer satisfaction score depends on this one metric.
The clock for this metric starts ticking from the time the customer raises a query to the time the customer’s need is met and the ticket is closed. It includes the waiting time and talk/chat time.
To ensure your team is efficient, prioritise this metric.
How to improve:
You can improve the resolution time by
- understanding what’s taking the agent’s time to resolve tickets,
- using canned responses to reply to customers,
- providing agents with customer data so they don’t have to toggle between platforms,
- routing tickets to the right agent such that the ticket is not transferred to another agent.
Suggested Reading: Resolving Conversations Faster With Canned Responses
9. User wait time
Definition: User wait time is the amount of time a user has to wait in between their ticket being picked up by an agent and transferred between agents/departments.
This customer support metric is a measure of the time the customer is expected to wait or be on hold. This usually happens when the customer is being transferred from one agent to another or if the agent is taking time to gather information to resolve the query.
Needless to say, a longer user wait time leads to customer frustration and irritation. This in turn leads to a poor customer experience.
How to improve:
To decrease the user wait time, you can
- automate a few processes, such as transferring the ticket to the right person in the right department,
- provide the agents with all customer data in one view so they have information to help them out, quickly.
10. First contact resolution (FCR)
Definition: First contact resolution is the percentage of tickets that were closed in the first contact by customers.
In other words, these chats were not transferred from one agent to another. Customers hate repeating themselves or being on a chat for a longer time than required. For customers, they raise a ticket only once and they want immediate resolution.
How to improve:
To ensure your user’s chats are resolved by the first agent who is assigned the chat, you need to
- properly train the agents,
- support them with relevant information and tools,
- apply smart routing where the AI considers agents’ skills to handle the chat,
- automate frequently asked questions,
- provide self service.
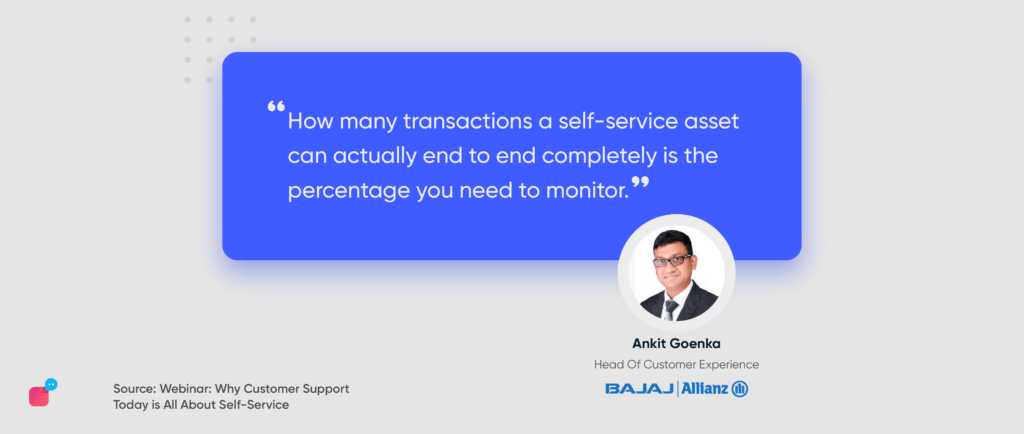
11. Bot deflection
Definition: Bot deflection is the total number of tickets closed/resolved by an AI-powered customer support conversational chatbot.
This customer support metric is also a measure of self-service ability. Wherein, you provide a system to your customers through which they can resolve their queries on their own. Automation can be in form of chatbots, voicebots, etc.
The more the customers use the self-service option, the better it is for your company. Why?
- It increases customer satisfaction as it’s faster and more convenient. It’s what your customers want.
- It frees up your customer support agents’ time letting them solve complex questions that require a human touch.
How to improve:
There are a couple of things you can do to ensure your bot achieves a high bot deflection rate:
- update the bot with commonly asked questions,
- create new chat workflows that address more use cases that don’t require human intervention,
- train the AI to understand more intents.
Suggested Reading: Industry Experts On Acing Customer Support: Tips And KPIs
12. Goal completion rate (GCR)
Definition: Goal completion rate is the percentage of users who complete a task while conversing with the agent.
GCR measures the number of customers that complete a task. For this, you need to first define your goals. The goals vary from industry to industry. The goal could be to identify the number of users who asked for a refund or the number of people who scheduled an on-site tour.
A high goal completion rate means a lot of your customers are reaching your set goals. On the converse, a low GCR means your goals are not being met.
How to improve:
To improve the goal completion rate you need to
- analyse low-performing goals.
- optimise the goals to make it easier for the customers,
- reduce the number of steps required to achieve the goal.
Suggested Reading: Launching Goal Completion Rate
Customer support metrics to measure quality
These customer service metrics measure the impact of the work that’s being done.
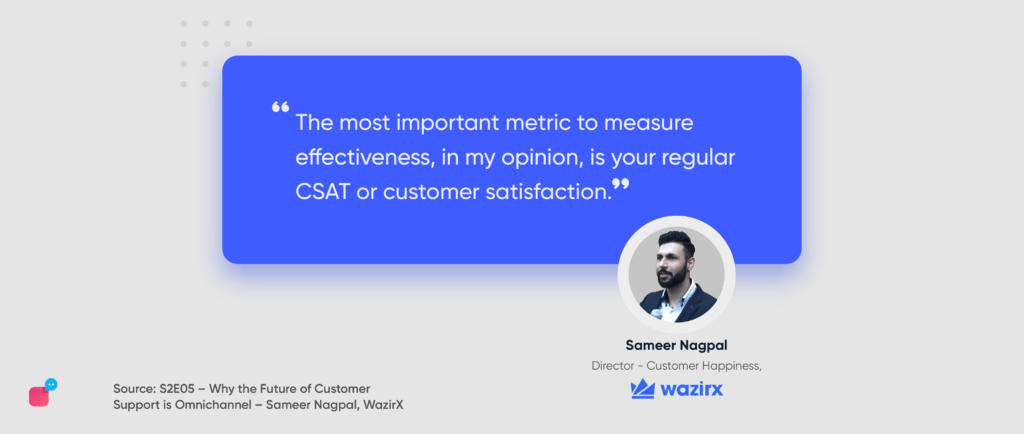
13. Customer satisfaction score (CSAT)
Definition: Customer satisfaction is a measurement that determines how happy customers are with a company's products, services, and capabilities.
Happy customers are good for business. They:
- Buy more
- Buy often
- Close more
- Close quicker
- Spend more and
- Reduce acquisition costs
To calculate CSAT, you need to ask your customers questions in the form of a survey and having them answer on a scale of 0-10. They can be categorised into:
- Very satisfied (9-10)
- Satisfied (6-8)
- Neutral (5)
- Unsatisfied (2-4)
- Very unsatisfied (0-1)
It’s a good opportunity to gauge the customer’s experience with your brand. This customer service metric gives you data that can be used to prevent customers from churning.
How to improve:
More often than not, angry customers are more likely to take your survey or leave reviews. To improve CSAT scores, you should
- encourage your happy customers to complete the survey,
- act on customer feedback to improve customer service.
Suggested Reading: CSAT Score: The Ultimate Guide
14. Net promoter score (NPS)
Definition: Net Promoter Score is the percentage of customers likely to recommend a company, a product, or a service to a friend or colleague.
While on one hand, CSAT measures the customer’s overall happiness with the company’s services, NPS indicates the impact customer support experience has had on the customer’s perception of the company. Basically, it tells you how likely they are to recommend your business to a friend.
To get this metric, companies should ask the customers questions about how likely they are to recommend and give their reasons by elaborating their answers.
The customers rate the company or the product or the service on a scale of 0 to 10 and can be categorised into:
- Promoters are the ones who score 9 or 10. They are loyal and enthusiastic customers.
- Passives are the ones who score 7 or 8. They are satisfied with your service but feel there is room for improvement.
- Detractors are the ones who score 6 or less. These are the unhappy customers who are unlikely to buy from you again. Not only that, they might even discourage others from buying from you.
How to improve:
You can improve the NPS scope by
- providing product/service features that the customers want,
- listening to what customers are asking,
- asking for more feedback and providing good customer service on time.
Suggested Reading: Journey Towards Building A Product That Users Love
15. Keywords used by users
Definition: Keywords used by the users are the terms/phrases/keywords used by customers in their queries.
This customer support metric helps you understand what questions/topics your customers are having trouble with. If many customers are talking about a topic, it indicates some problem and you need to fix it.
You can also track the categories of the frequently asked questions. If a category is being asked more often than others, you can work on how to improve this section, making it easier for the customers to find relevant information.
This is a quality metric as it helps you understand what kind of questions your customers are asking. Sometimes you can find a solution in automation and self-service.
How to improve:
With this data, you can improve your frequently asked questions in the chatbot and Help page. If this information is easily available, your customers will not raise tickets for it.
You can also use this data to understand how your users talk and train your customer support staff to mirror the language, making them feel comfortable.
Suggested Reading: 13 Reasons To Add Live Chat On Your Website
Conclusion
To ensure customers are getting what they want, you need to measure the support team’s performance and optimise it to deliver even better experiences. After all, CX gives you an edge over your competitors.
Metrics guide your team in the right direction. It’s like driving a car. First, you need to start by understanding and getting comfortable with the clutch, knowing where is the accelerator and brakes and when to change gears. Once you master these things, you can confidently drive and steer your car in the direction you want to go.
Similarly, first, you need to identify which metrics you want to track and then start keeping a tab on them. Once you have data, you can steer your customer support in the direction of a better customer experience.
At Verloop.io, our dashboards and master reports showcase these data in a friendly/intuitive manner. G2 awarded us with Best Software tool 2022 in the analytics and AI category. Over 5000 brands such as Nykaa, ADIB, Rak Bank, Kanmo Group, and more use Verloop.io to provide delightful customer support experiences to their users.
If you’d like to learn more, talk to our team to demo the product for you.