14 Customer Service KPIs You Must Track in 2025
- November 20th, 2024 / 4 Mins read
- Namrata Narsinghani
14 Customer Service KPIs You Must Track in 2025
- November 20th, 2024 / 4 Mins read
- Namrata Narsinghani
Your customer service team is working harder than ever, but are they actually delivering better customer experiences? Without tracking the right Key Performance Indicators (KPIs), it’s impossible to know.
As specialists in customer support automation, serving 500+ enterprises globally, we’ve seen how high-performing support teams measure and optimise their performance.
Drawing on that experience, we’ll break down the most impactful customer service KPIs you need to track in 2025.
From traditional metrics that still prove invaluable to modern indicators that reflect changing customer expectations, you’ll learn exactly what to measure to improve your customer service operations.
5 Core Customer Service KPIs
Customer service has evolved dramatically, but some metrics remain essential.
Before diving into modern KPIs for customer support, let’s quickly cover these time-tested metrics that directly impact your business outcomes.
1. Customer Satisfaction Score (CSAT)
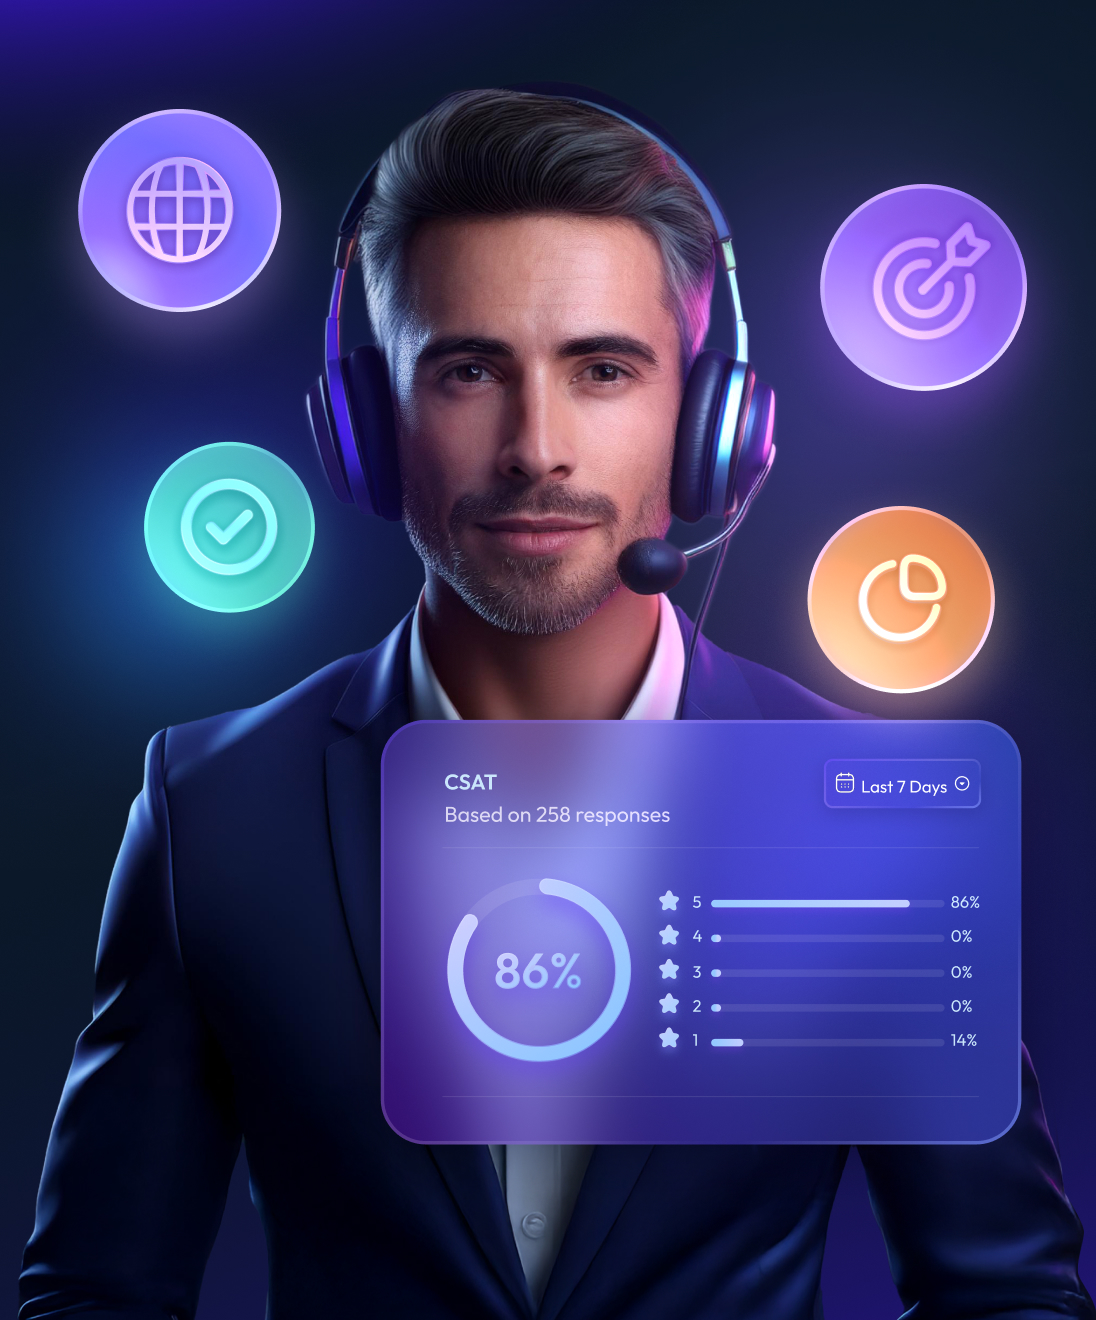
CSAT remains the gold standard for measuring customer service quality. Almost 90% of customers report trusting a company whose service they rate as “very good.” However, most companies average only 75-85% CSAT scores, indicating significant room for improvement.
Most companies collect CSAT scores through post-interaction surveys, but the real value lies in how you analyse and act on this data. The most effective approach is to break down CSAT by:
- Channel (email, phone, chat)
- Issue type (billing, technical, product)
- Customer segment (new vs. existing, premium vs. standard)
- Resolution time (immediate vs. delayed)
This granular analysis often reveals surprising insights. For instance, you might find that customers are more satisfied with longer interactions that fully resolve their issues than quick interactions that require follow-up. Or that certain types of issues consistently score lower, indicating a need for better training or process improvements in those areas.
Suggested read: 20 Ways to Improve Customer Satisfaction
2. Net Promoter Score (NPS)
While CSAT measures immediate satisfaction, NPS indicates long-term loyalty. According to Bain & Company (who coined NPS), companies that lead their industry in NPS typically grow at more than twice the rate of their competitors.
The power of NPS lies in combining quantitative scores with qualitative feedback. Beyond tracking your overall score, focus on:
- Identifying common themes in detractor feedback
- Understanding what turns passives into promoters
- Analysing NPS trends by customer segment
- Correlating NPS with customer lifetime value
Companies that close the feedback loop with detractors within 24-48 hours experience a 6-point increase in NPS.
3. Customer Effort Score (CES)
Gartner’s research revealed a stunning insight: 96% of customers who experience high-effort service interactions become more disloyal, compared to just 9% with low-effort experiences. CES has become a critical predictor of customer loyalty, sometimes even more accurate than CSAT or NPS.
The beauty of CES lies in its simplicity – asking customers how much effort they had to expend to get their issue resolved. But don’t just track the score. Analyse effort across:
- Different service channels
- Issue types and complexity levels
- Customer segments
- Resolution pathways
High effort scores often reveal unnecessary steps in your service process, channel switching problems, knowledge base gaps or complex policies and procedures.
More importantly, CES helps identify opportunities for proactive service. When you spot high-effort touchpoints, you can often eliminate them entirely through better process design or automation.
For more information: What is Customer Effort Score & How to Improve it?
4. Customer Retention Rate
Studies consistently show that acquiring a new customer costs 5-25 times more than retaining an existing one (Harvard Business Review). But retention rate isn’t just about keeping customers – it’s about understanding why they stay or leave.
To make this metric actionable, segment your retention analysis by:
- Customer tenure (new vs. long-term)
- Service interaction frequency
- Issue resolution satisfaction
- Product usage patterns
High retention rates often mask underlying problems. For example, customers might stay despite poor service due to high switching costs or lack of alternatives. That’s why it’s crucial to analyse retention alongside satisfaction metrics for a complete picture of customer loyalty.
5. Cost Per Resolution
As customer service channels multiply, understanding your cost per resolution helps optimise resource allocation and justify technology investments.
The key is measuring both direct costs (agent time, tools) and indirect costs (training, infrastructure). More importantly, analyse cost variations across:
- Resolution channels (self-service vs. agent-assisted)
- Issue complexity (tier 1 vs. tier 2)
- Customer segments (high-value vs. standard)
Remember, the goal isn’t always to minimise costs. Sometimes, investing more in resolution quality leads to lower total service costs through reduced repeat contacts and higher customer retention.
Modern Customer Support KPIs for 2025 & Beyond
While foundational KPIs in customer support track service outcomes, modern metrics help you optimize the service experience itself.
The following metrics reflect how AI, automation, and changing customer expectations are reshaping customer support.
1. First Impactful Response Time (FIRT)
First Impactful Response Time measures how quickly customers receive a response that moves them toward resolution, not just an automated acknowledgment. This metric has become essential as customers expect more than just quick automated replies.
What counts as an impactful response:
- A solution or clear next steps
- Specific troubleshooting steps
- Relevant knowledge base articles
- Collection of essential information through targeted questions
Why it matters: Traditional first-response metrics can hide poor service behind quick but empty responses. FIRT helps support teams focus on quality over speed. Teams should track both metrics to understand the gap between initial contact and meaningful help.
2. Chatbot Containment Rate
Chatbot containment measures successful AI resolutions, not just conversations handled by bots. This distinction matters because high containment with poor resolution creates frustrated customers and increases costs through callbacks.
Key measurements:
- Complete Resolution Rate: Issues fully resolved by AI without human intervention
- Partial Resolution Rate: Issues where AI handled significant parts before human handoff
- Containment Quality: Customer satisfaction with AI-only interactions
- Learning Velocity: How quickly your AI improves containment rates for new issues
- Cost Impact: Savings from successful containment vs. cost of failed containment attempts
Common problems to watch:
- High containment but low satisfaction (AI might be creating barriers to human help)
- Low containment for common issues (potential training gaps)
- Frequent post-containment callbacks (incomplete resolutions)
- Channel switching after AI interaction (frustration indicators)
3. SLA Compliance Rate
Support teams now manage a complex web of promises to customers across multiple channels. Traditional SLA tracking focused on “Did we respond in time?” Modern SLA compliance asks “Did we deliver the right service, through the right channel, at the right time?”
Your customer might start with a chatbot, switch to email, and end up on a call – each transition carries its own service promise. Success means tracking:
- Response times by issue priority and channel
- Quality of responses, not just speed
- Smooth handoffs between AI and human agents
- After-hours support effectiveness
- Resolution time commitments
The trick is balancing speed with quality. High compliance rates mean little if customers need to contact you twice.
4. Next Issue Avoidance
While most metrics look at past performance, Next Issue Avoidance focuses on preventing future support needs. This forward-looking metric helps break the cycle of repetitive issues and builds a more efficient support operation.
Smart support teams use this metric to:
- Identify and fix common issue triggers before customers report them
- Create targeted help content based on customer friction points
- Send proactive alerts about potential problems
- Improve product features that cause frequent support needs
- Build better onboarding to prevent initial confusion
5. Intent Analysis Accuracy
Support tickets don’t always tell the full story. A customer asking about a feature might really be struggling with their core use case. Intent analysis helps you understand what customers really need, not just what they’re asking for.
Smart teams use intent analysis to:
- Spot emerging product issues before they become widespread
- Improve chatbot responses based on real customer language
- Train agents on handling common customer goals
- Build better self-service content that matches customer needs
- Identify upsell opportunities in support conversations
When done right, intent analysis transforms reactive support into proactive problem-solving. It helps identify product gaps, improve documentation, and train both AI and human agents to respond to underlying customer needs.
Must read: Intents and Entities – The Building Blocks of an AI Chatbot
6. Channel Experience Metrics
Customers don’t think in channels – they think in problems and solutions. A customer might start on your website, move to chat, and finish via email. Success means measuring the entire journey, not just individual touchpoints.
Track how customers:
- Move between channels to solve their problem
- Successfully complete their goal in each channel
- Prefer different channels for different issues
- React to channel transitions
- Find the fastest path to resolution
The goal? Understanding which paths lead to fastest resolution, where customers get stuck, and how to optimize your channel mix for different customer needs.
7. Self-Service Success Rate
Self-service isn’t just about having a knowledge base – it’s about customers finding and using the right information at the right time.
Measure how customers:
- Find answers through search
- Complete tasks without human help
- Use guides and tutorials
- Navigate help documentation
- Return to self-service for future issues
The goal isn’t pushing everyone to self-service. It’s making self-service so good that customers prefer it for simple issues, freeing up agents for complex problems.
8. AI-Human Handoff Effectiveness
The transfer between AI and human support is a make-or-break moment. When customers repeat information or lose context during handoffs, it damages their experience and trust in your service.
Key measurements include:
- Context and information flows between systems
- Customers respond to handoff experiences
- AI predicts and initiates escalations
- Agents access and use handoff information
- Resolutions speed changes after transfers
9. Consistent Resolutions
With support spread across AI chatbots, human agents, and multiple channels, delivering consistent answers becomes crucial.
A billing question should get the same accurate response whether through chat, email, or phone. More importantly, solutions provided by AI should match those given by human agents.
Track how:
- Solutions align across different channels
- AI and human responses maintain consistency
- Agent teams follow quality standards
- Brand voice stays uniform
- Resolution steps remain standardized
- Templates and macros maintain accuracy
- Knowledge base stays updated
Transform Your Customer Service with AI-Driven Insights
These modern metrics highlight a crucial evolution in customer service – from simply measuring response times to understanding and optimizing the complete customer experience.
For support teams using AI, these metrics are essential to balance automation efficiency with service quality and maintain customer trust through every interaction.
Verloop.io’s conversational AI platform helps you excel in these modern metrics. Our platform not only automates routine support but also provides detailed analytics on containment rates, handoff effectiveness, and resolution consistency.
With intelligent chatbots handling tier-1 support and seamless escalation to human agents, you can deliver faster, more consistent customer service while maintaining high satisfaction scores.
See how Verloop.io can transform your customer support with intelligent automation. Schedule a demo today!