
Hosted By

Harshitha Raja
Product Marketing Specialist, Verloop.io
Panellists
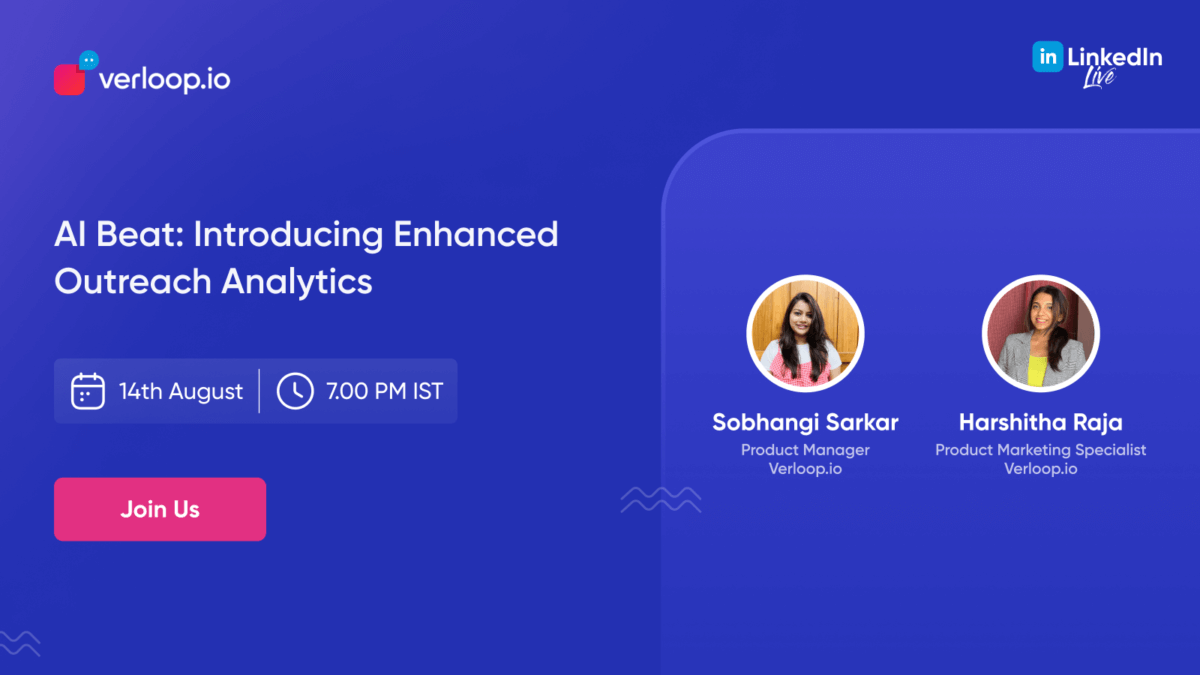
Ready to take your outreach strategy to the next level with cutting-edge analytics? Join us on a journey to master Verloop.io’s Enhanced Outreach Analytics with our expert, Sobhangi Sarkar, Senior Product Manager at Verloop.io.
On August 14th at 7 PM, we hosted an exclusive LinkedIn Live webinar, “AI Beat: Introducing Enhanced Outreach Analytics.” Missed it? Don’t worry! You can still access all the game-changing insights and actionable strategies shared during the session.
Don’t miss out on the full experience! Request the webinar recording now and discover how to transform your outreach efforts into data-driven successes.
Webinar Transcript:
AI Beat: Introducing Enhanced Outreach Analytics
- Harshitha : Hey everyone, and welcome to the first episode of Verloop.io’s AI Beat! Here at AI Beat, we will be diving into the latest innovations, product updates, and exciting launches from Verloop. Each of our episodes is dedicated to providing you with insights and strategies to enhance your customer engagement.Hello, I’m Harshitha, Product Marketing Specialist here at Verloop.io.Today, we’re thrilled to introduce you to an upcoming launch from Verloop.io. A game-changing innovation that will transform how you manage and analyse your outreach efforts. Outreach. Outreach is a powerful tool for businesses to connect with their audience. Over the past few months, we’ve listened to your feedback and identified a recurring theme: the need for better tools to track and optimise outreach campaigns. Whether you’re striving to enhance campaign performance or focused on maximising ROI, the challenges are real and significant. Traditional methods often fall short, leading to inefficiencies and missed opportunities. And that’s where our upcoming launch comes in. The Enhanced Outreach analytics dashboard is designed to provide you with clear insights into your outreach performance, helping you make data-driven decisions to optimise your campaigns. But before we dive into the specifics, I’d like to introduce our special guest for today, Sobhangi Sarkar, our Product Manager here at Verloop.io. Hello Sobhangi!
- Sobhangi : Hi Harshitha! Hi everyone! I’m thrilled to be here today to share all the exciting details about our upcoming Enhanced Outreach Analytics with y’all.
- Harshitha : Great to have you here, Sobhangi! Before we get started, could you tell us a bit about yourself and your role here at Verloop.io?
- Sobhangi : Sure Harshitha. So I am currently a part of the product team here at Verloop and I’m truly enjoying it. We focus on developing solutions that ensure our AI Agents effectively meet user needs and align with our customers’ business goals.
- Harshitha : Thanks, Sobhangi. So Sobhangi has been instrumental in developing this powerful tool, and she’ll be sharing valuable insights and answering all our questions. So without further ado, I think we should set the stage by talking about the market challenges and user feedback that highlighted the need for the Enhanced Outreach Analytics.Sobhangi, over to you!
- Sobhangi : Sure! So as Harshitha mentioned, businesses often struggle to measure the impact of their outreach efforts. They might be sending out countless messages, but are they hitting the right audience and driving desired actions?Let me break down some of the common challenges businesses face.Lack of visibility is the most significant. Many businesses struggle to track the performance of their outreach campaigns. They don’t have a clear picture of which messages are resonating with their audience and which ones are falling flat. Second, Inefficient resource allocation. Without data-driven insights, it’s difficult to allocate resources effectively. Businesses may be investing time and effort into campaigns that aren’t yielding the desired results. Next up there’s the Difficulty measuring ROI. Quantifying the return on investment of outreach efforts is a major challenge. It’s hard to determine the impact of outreach on sales, leads, or other key metrics. And last but not least, is definitely the time-consuming process of manual analysis. Manually analysing outreach data is time-consuming and prone to errors. Businesses need efficient tools to streamline this process. And for businesses to address these challenges, they needed a straightforward way to see how well their campaigns were performing, identify areas for improvement, and optimise their strategies. This feedback drove us to develop the Enhanced Outreach Analytics. It is coming up to be a tool that provides comprehensive, actionable insights through an intuitive interface, enabling better decision-making and resource allocation.
- Harshitha : Yes Sobhangi, those are some really insightful points. It’s clear that businesses need a better way to understand the impact of their outreach efforts. The challenges you’ve outlined are exactly what many businesses are facing today.I’m excited to see how the Enhanced Outreach Analytics dashboard can address these pain points. Can you tell us more about how this helps businesses gain visibility into their outreach performance?
- Sobhangi : Absolutely, Harshitha! Our upcoming Enhanced Outreach Analytics is designed to provide a comprehensive overview of your outreach performance. It’s basically like having a control centre for your outreach campaigns. Let me briefly explain the benefits of the dashboard to you.The most important of our this tool would be its user-friendly interface. The dashboard is very easy to navigate and interpret data, even for non-technical users.It helps with real-time data visualisation and gaining actionable insights. So you can see your campaign performance as it happens and also quickly identify what’s working and what isn’t. So this means enhanced decision-making. With the help of outreach analytics, you are equipped to make informed decisions to optimise your outreach strategies. And to facilitate the access to detailed analytics, we also have customisable filters. This allows precise analysis by filtering data according to your needs.
- Harshitha : This sounds incredibly useful Sobhangi. Can you share a bit about the development journey? How did this concept come to life?
- Sobhangi : Of course. So the development journey started with understanding our users’ needs. We then conceptualised a dashboard that could turn raw data into meaningful insights. Our design team focused on creating an intuitive interface, while our tech team worked on integrating robust analytics and ensuring real-time data accuracy. It was a collaborative effort across multiple teams to bring this vision to life. And the good news is we’re almost done with the development and will be launching this very soon. So audience, stay tuned!
- Harshitha : That’s fantastic Sobhangi. I’m sure the customers would benefit so much from all of your efforts and are eagerly waiting for the launch. To give our audience a better understanding of how the Enhanced Outreach Analytics works, would you like to give us a sneak peek? What are the different types of data our users can analyse with this tool?
- Sobhangi : Oh I’d love to! Let me start by explaining the Analytics Tab entirely. Here’s what you’ll find:This is the Message Statistics Widget. This shows a pie chart with the distribution of messages triggered, sent, failed, delivered, and read. This gives you a clear picture of your outreach volume and helps you quickly see the overall performance of your campaigns.This is the Template Performance widget. This data table highlights the performance of different templates, showing metrics like delivery rates, read rates, engagement, that is- whether your customer clicked or replied. This comes very handy is you want to know which message templates are driving the best results This is the Engagement Trends widget that helps you monitor reading and response patterns over time. This widget helps you identify the outreach with the most engagement. You can use this to discover your top-performing outreach campaigns to replicate their success. This feature highlights the campaigns that are generating the most interactions. Each feature here in the analytics tab is designed to provide clear, actionable insights to help you refine your strategies. Other than this we also have customisable filters to further enhance your whole outreach analysis process. In the Outreach dashboard, you can filter the data by the Whatsapp Business Account numbers, date ranges, outreach names, and template names. You can select the desired filters to focus on the most relevant data for your analysis.
- Harshitha : Wow that’s a lot of useful information at a glance Sobhangi! Being from Marketing, I’m particularly really interested in the template performance widget. I think I’ll be using that a lot. You know right? How marketing is always looking into their outreach efforts and seeing how the audience respond to their templates. Being able to identify which messages are resonating with the audience is incredibly valuable.
- Harshitha : Now, going beyond our upcoming launch, I heard there’s also going to be several new updates to enhance the overall outreach feature in Verloop. So…Could you please spill some beans there?
- Sobhangi : Haha surely, Harshitha. We’re expecting some upcoming enhancements to our entire Outreach feature that are really exciting.First up, we have Outreach-Specific Reports. Users can now generate detailed reports specific to individual outreach campaigns. These reports provide deeper insights into campaign performance, helping you understand the impact and effectiveness of each outreach effort.Secondly We’re planning an error Code Distribution Widget to our analytics tab. Identifying why messages aren’t reaching your audience is crucial. This feature would help in breaking down error codes, helping you pinpoint issues like invalid phone numbers or network problems. This would be very helpful for you to troubleshoot and improve delivery rates. Other than this, we’re also planning to be adding CTA click-throughs. This feature would help customers to analyse who clicked on their CTAs in their outreach campaigns. This will help them better evaluate their outreach performance and gather the right audience for their future campaigns who are more likely to engage. These updates are being planned to give you more control and flexibility over your outreach activities, ensuring that you can optimise every aspect of your campaigns.
- Harshitha : That’s fantastic, Sobhangi. It’s clear that our Outreach Dashboard is getting equipped to provide businesses with so many actionable insights! I’m sure our audience are eagerly waiting for all these features to be out!I think that’s all I’ve got for today. But before we wrap up, let’s recap the key takeaways from today’s webinar.We’ve learned that traditional outreach methods often lack the necessary data to optimise campaigns. The Enhanced Outreach Analytics offers a solution by providing a centralised platform to track and analyse outreach performance. It helps us – Gain a clear understanding of their audience – Identify top-performing campaigns – Optimise outreach efforts for maximum impact – And make data-driven decisions to improve ROI Stay tuned to explore our Enhanced Outreach Analytics and see how it can elevate your outreach strategy. If you have any questions or would like to learn more, please don’t hesitate to reach out to us.
- Sobhangi : Thanks, Harshitha. You’ve summarised it perfectly. The Enhanced Outreach Analytics is all set to be a powerful tool for businesses to achieve their outreach goals. We’re confident that it will help you improve your campaigns and drive better results.Thank you all for attending today’s webinar. Like Harshitha said, our Enhanced Outreach Analytics is coming soon, so stay tuned! And for any further assistance or questions, please feel free to reach out to us.
- Harshitha : Thank you, Sobhangi, for sharing your expertise and insights. We appreciate you taking the time to share your knowledge with our audience today.Thank you all for joining us today. We hope this webinar has been informative and valuable.Until I see you in the next episode of Verloop’s AI Beat, stay curious and keep exploring the endless possibilities of AI!


